Asset Analytics
Last updated: July 24, 2026
Mutiny gives you a full picture of how visitors are engaging with your assets. From the analytics page, you can review top-level metrics, dig into individual visits, and even ask the agent to generate custom reports across your assets.
Accessing Asset Analytics
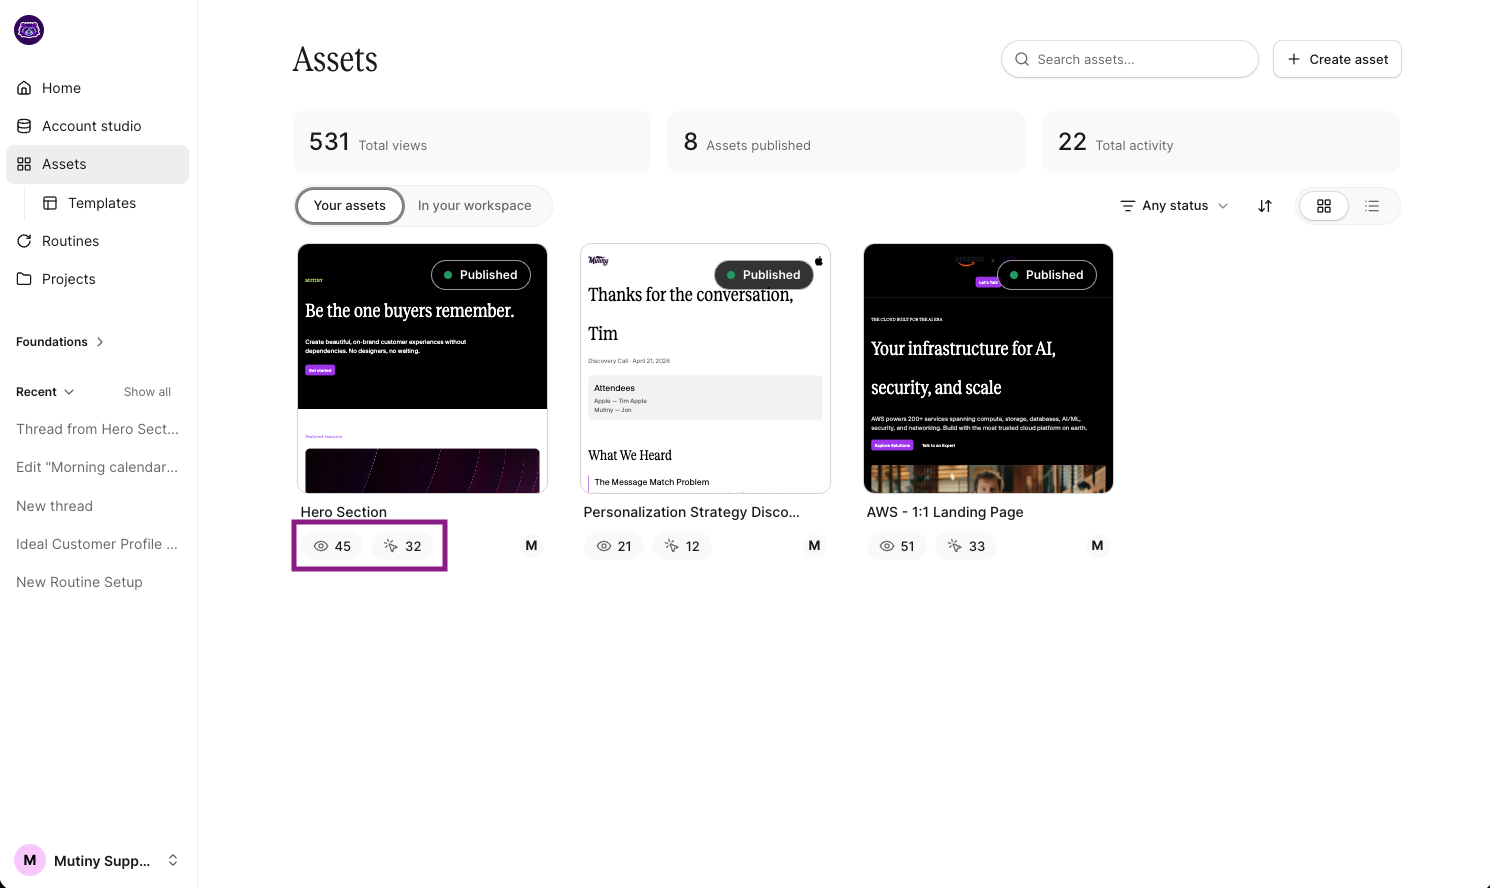
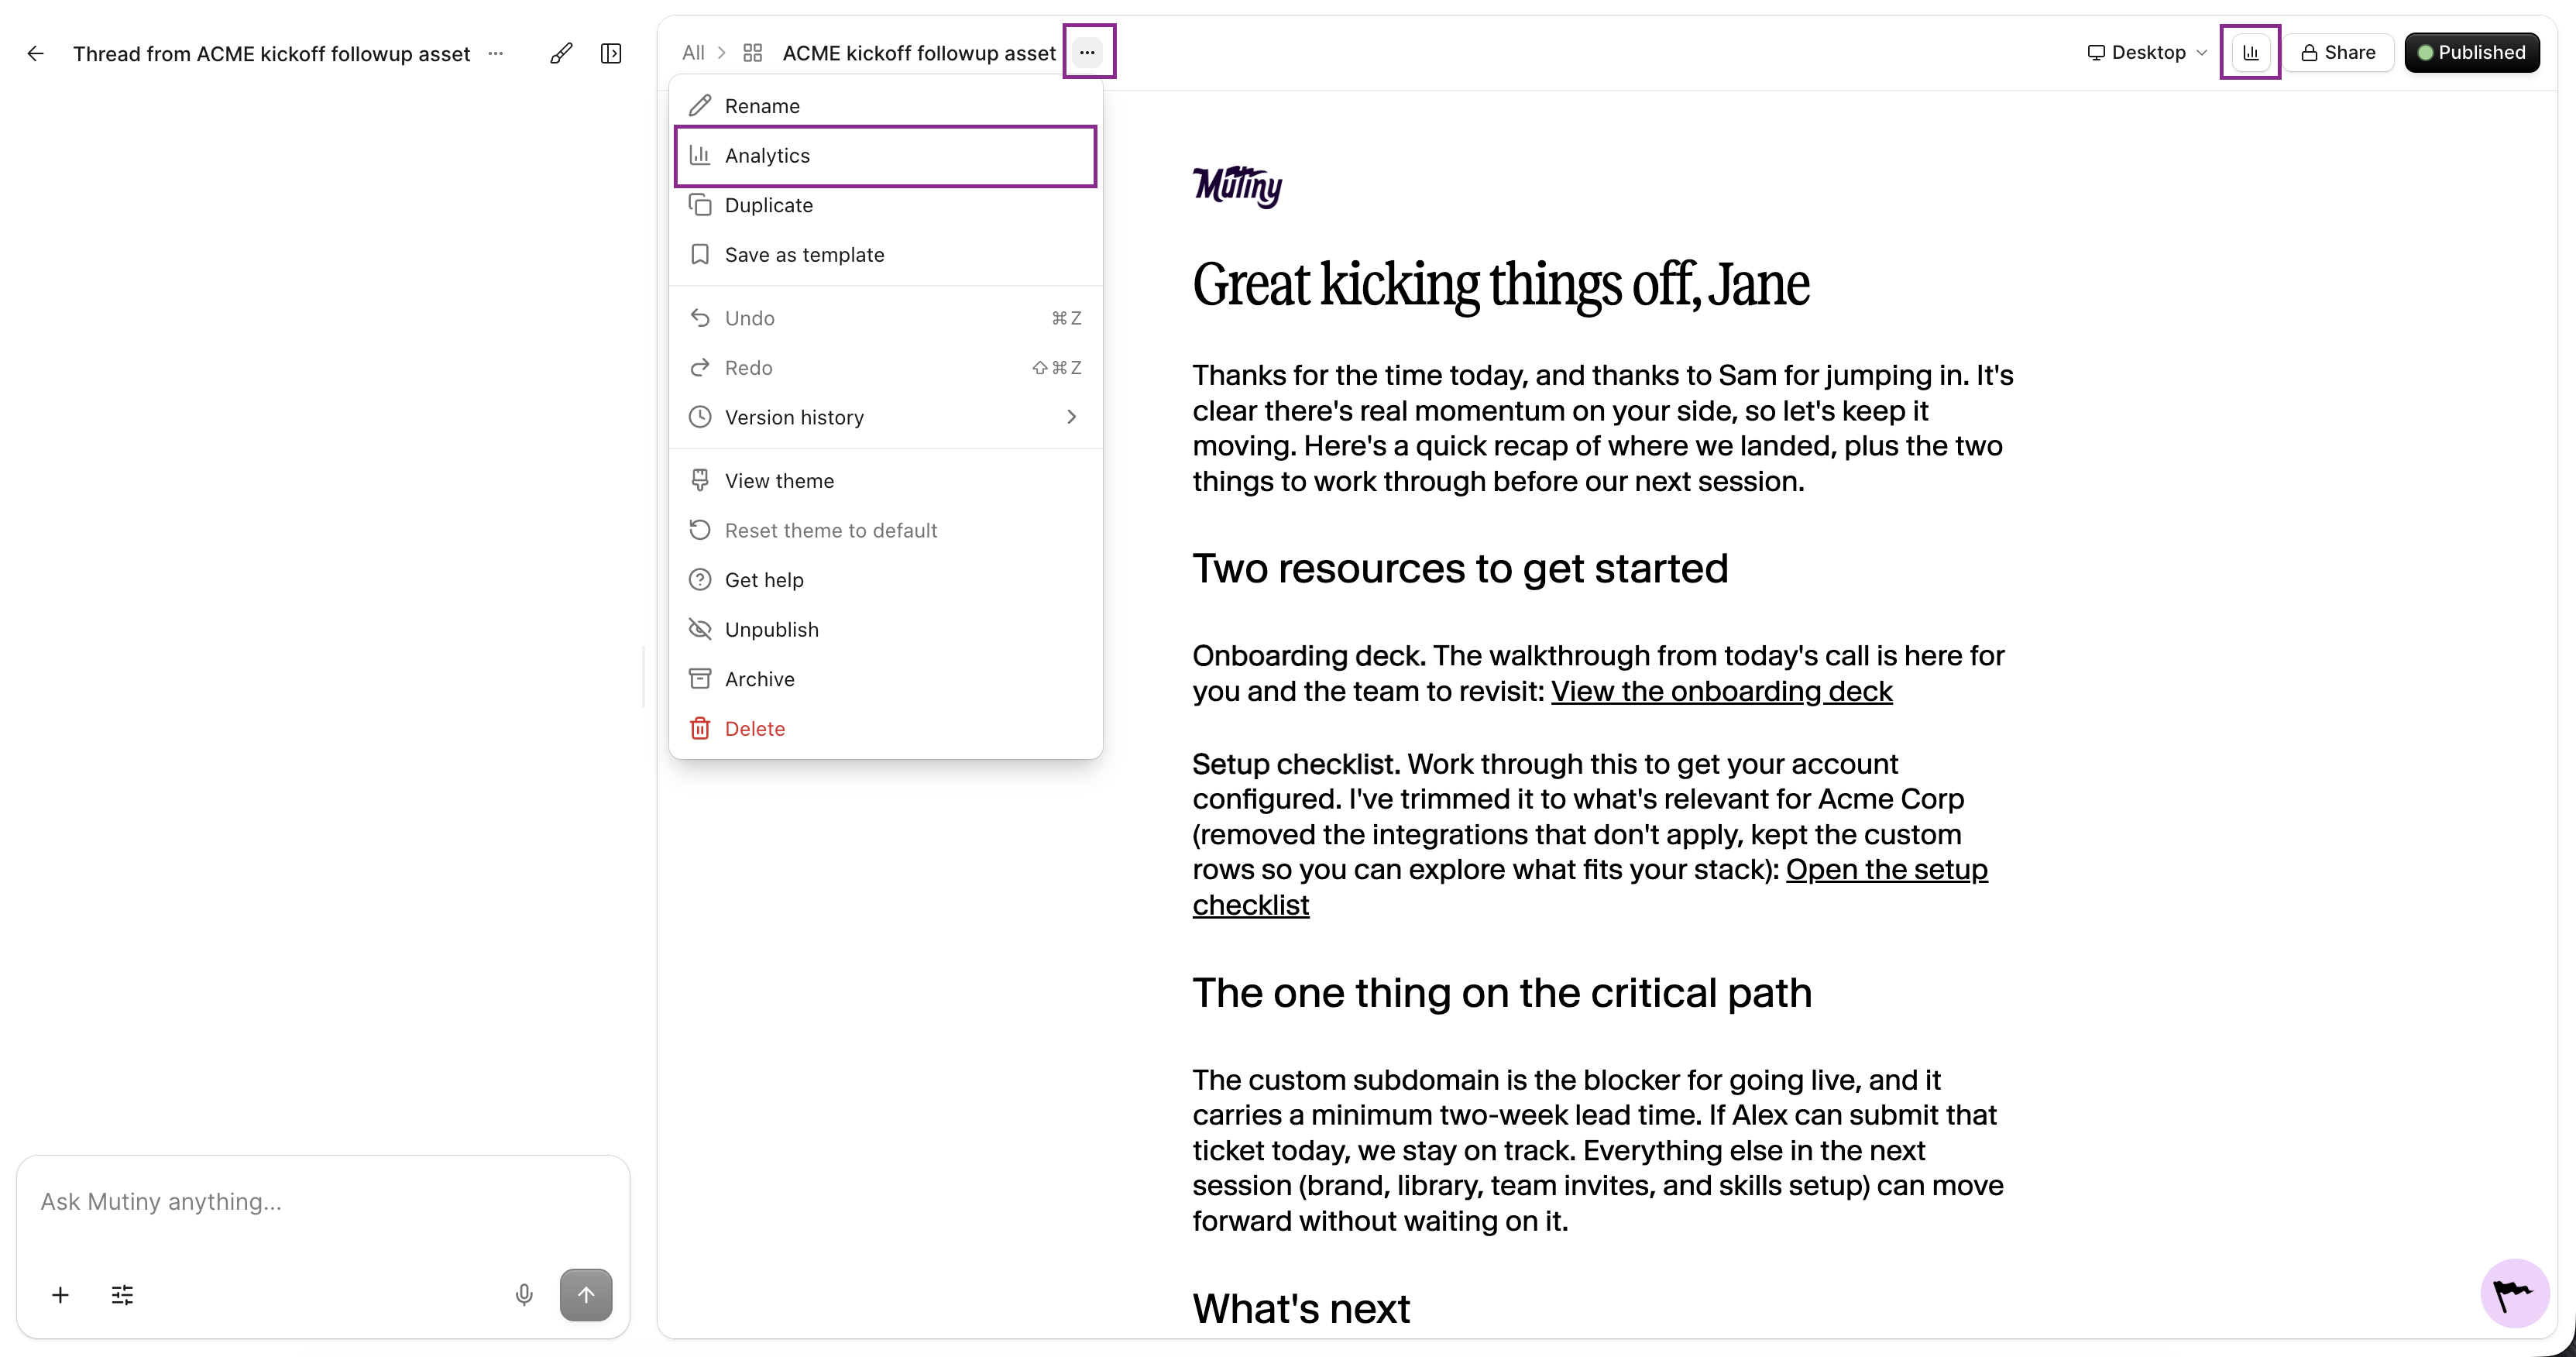
To view a breakdown of asset analytics, click either of the analytic icons on the asset card or click on the card itself, and then switch to the analytics view from the asset editor:
The Analytics Page
Top-level metrics
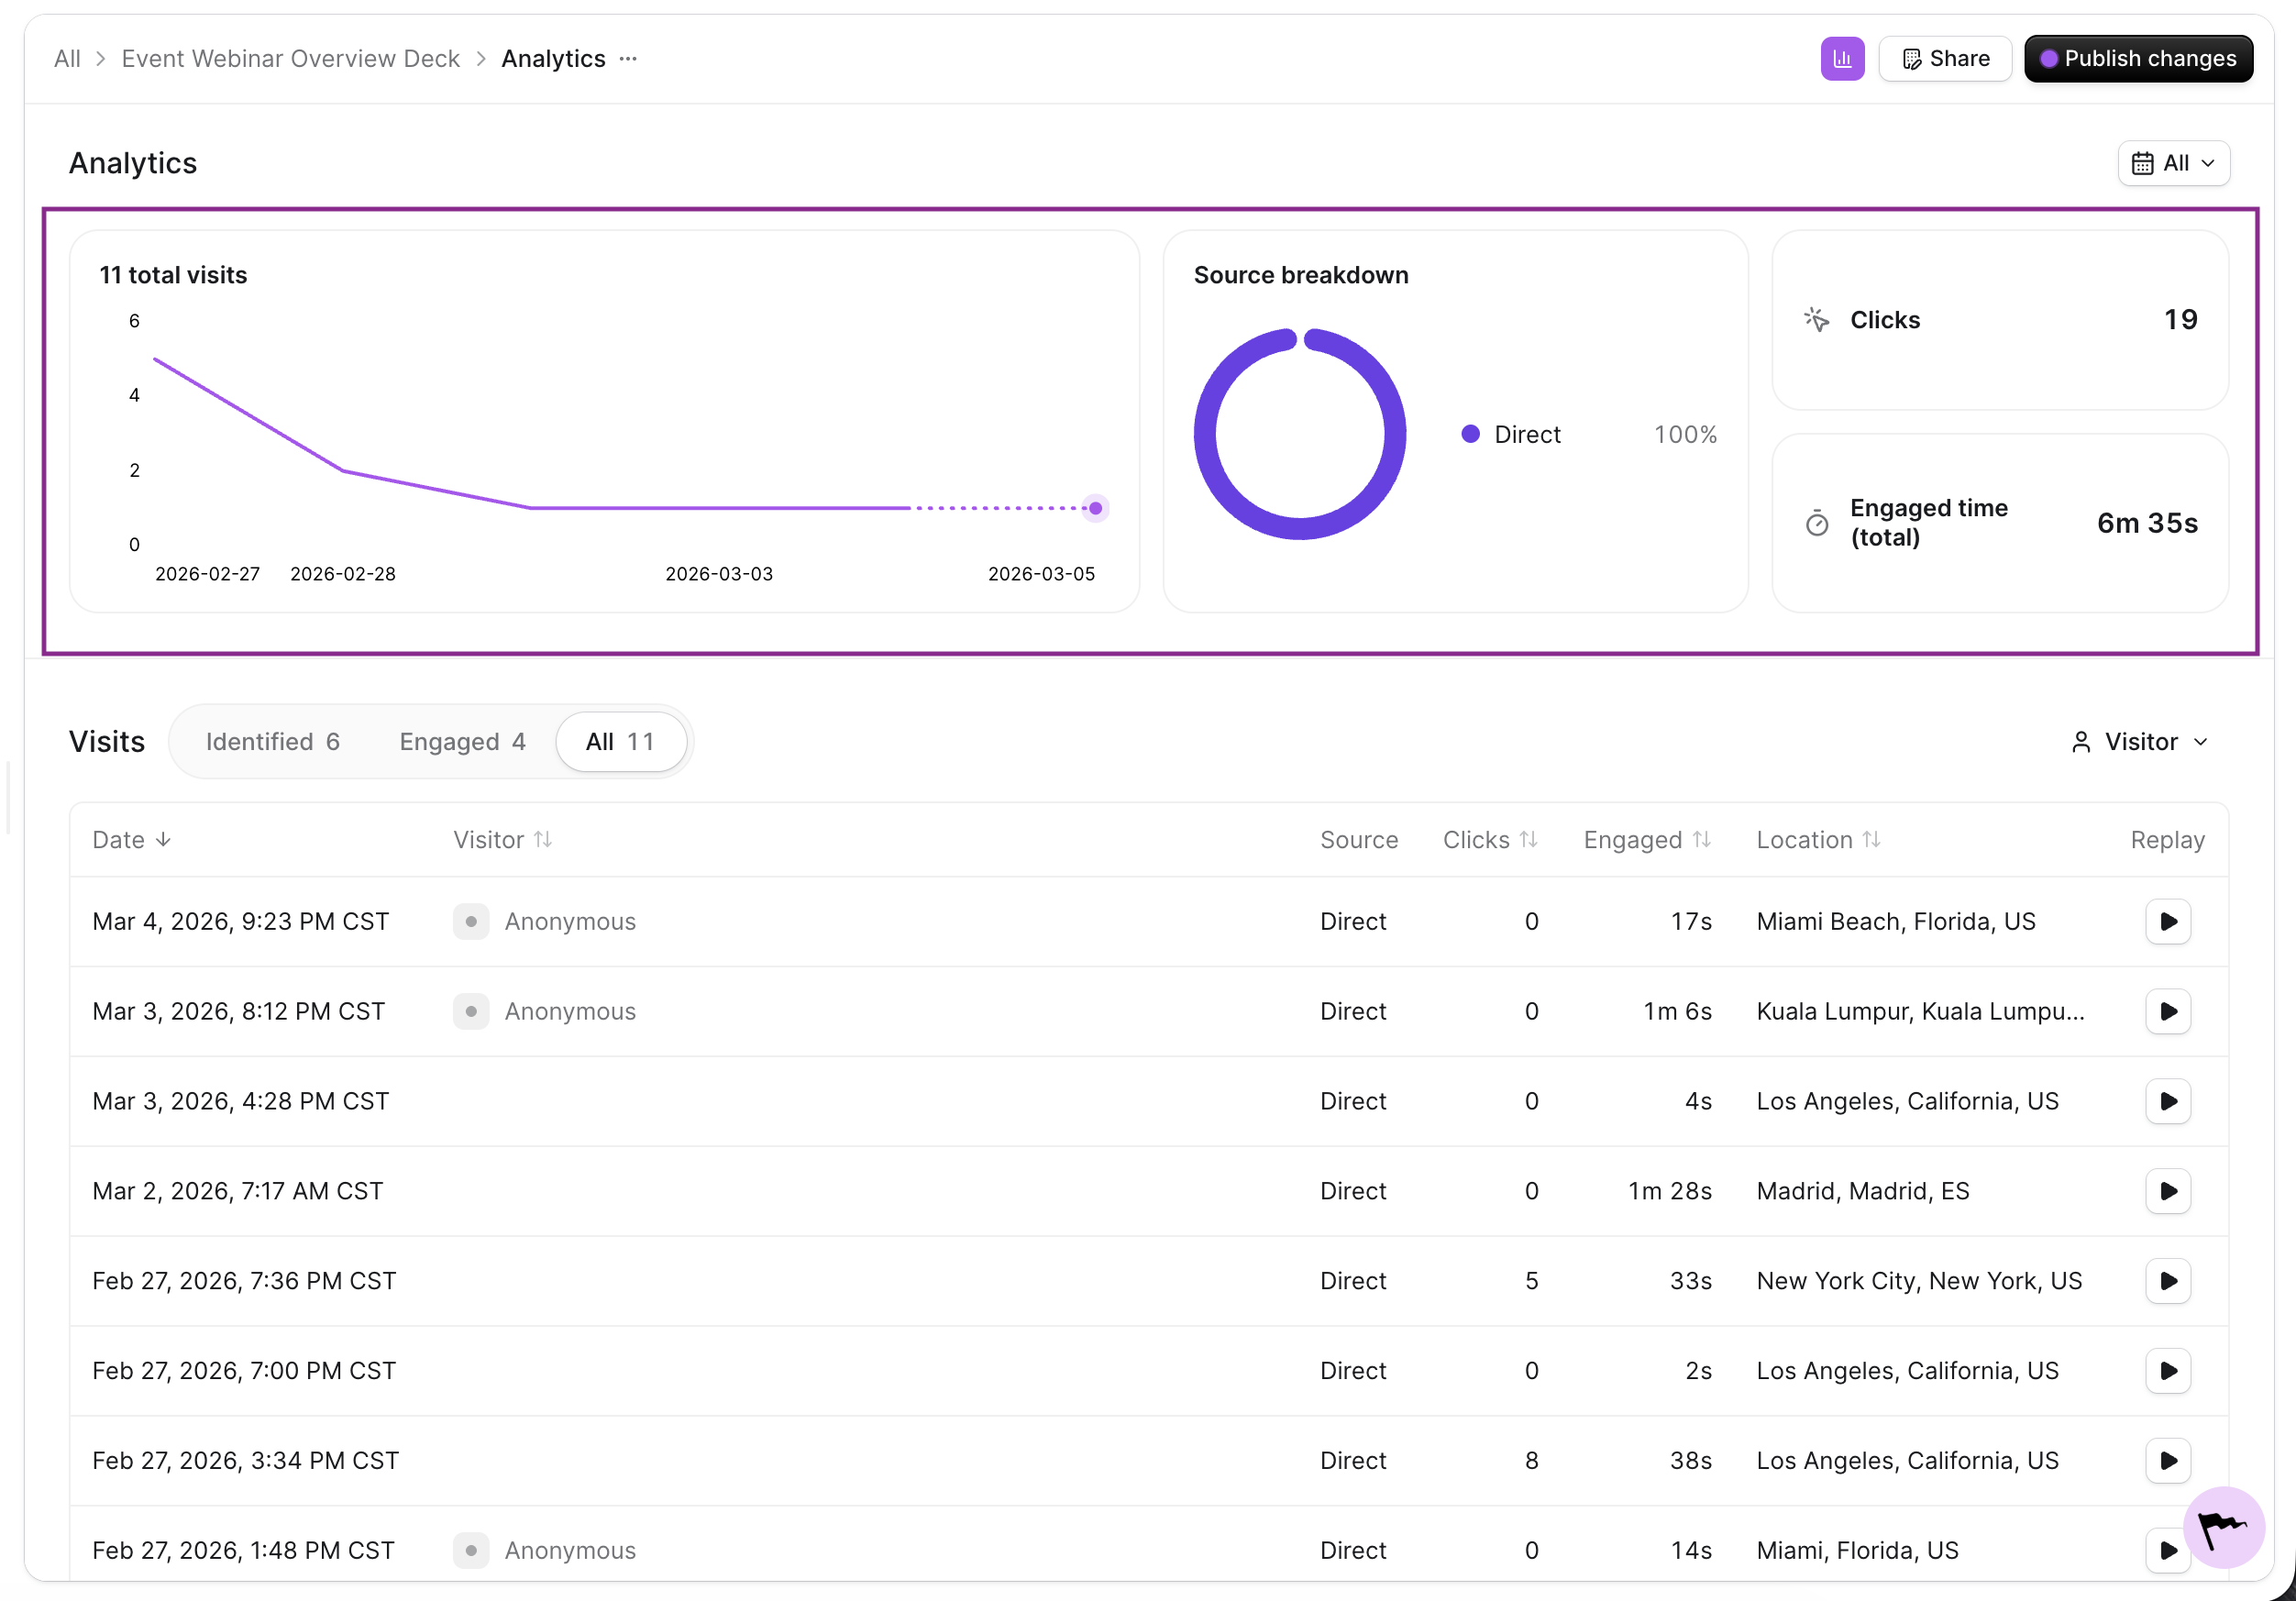
At the top of the analytics page, you'll see a bar graph showing visits over time along with a source breakdown so you can see where your visits are coming from. You'll also see total clicks and total engaged time. These give you a quick read on overall performance before you dig into individual visits.
The visits table
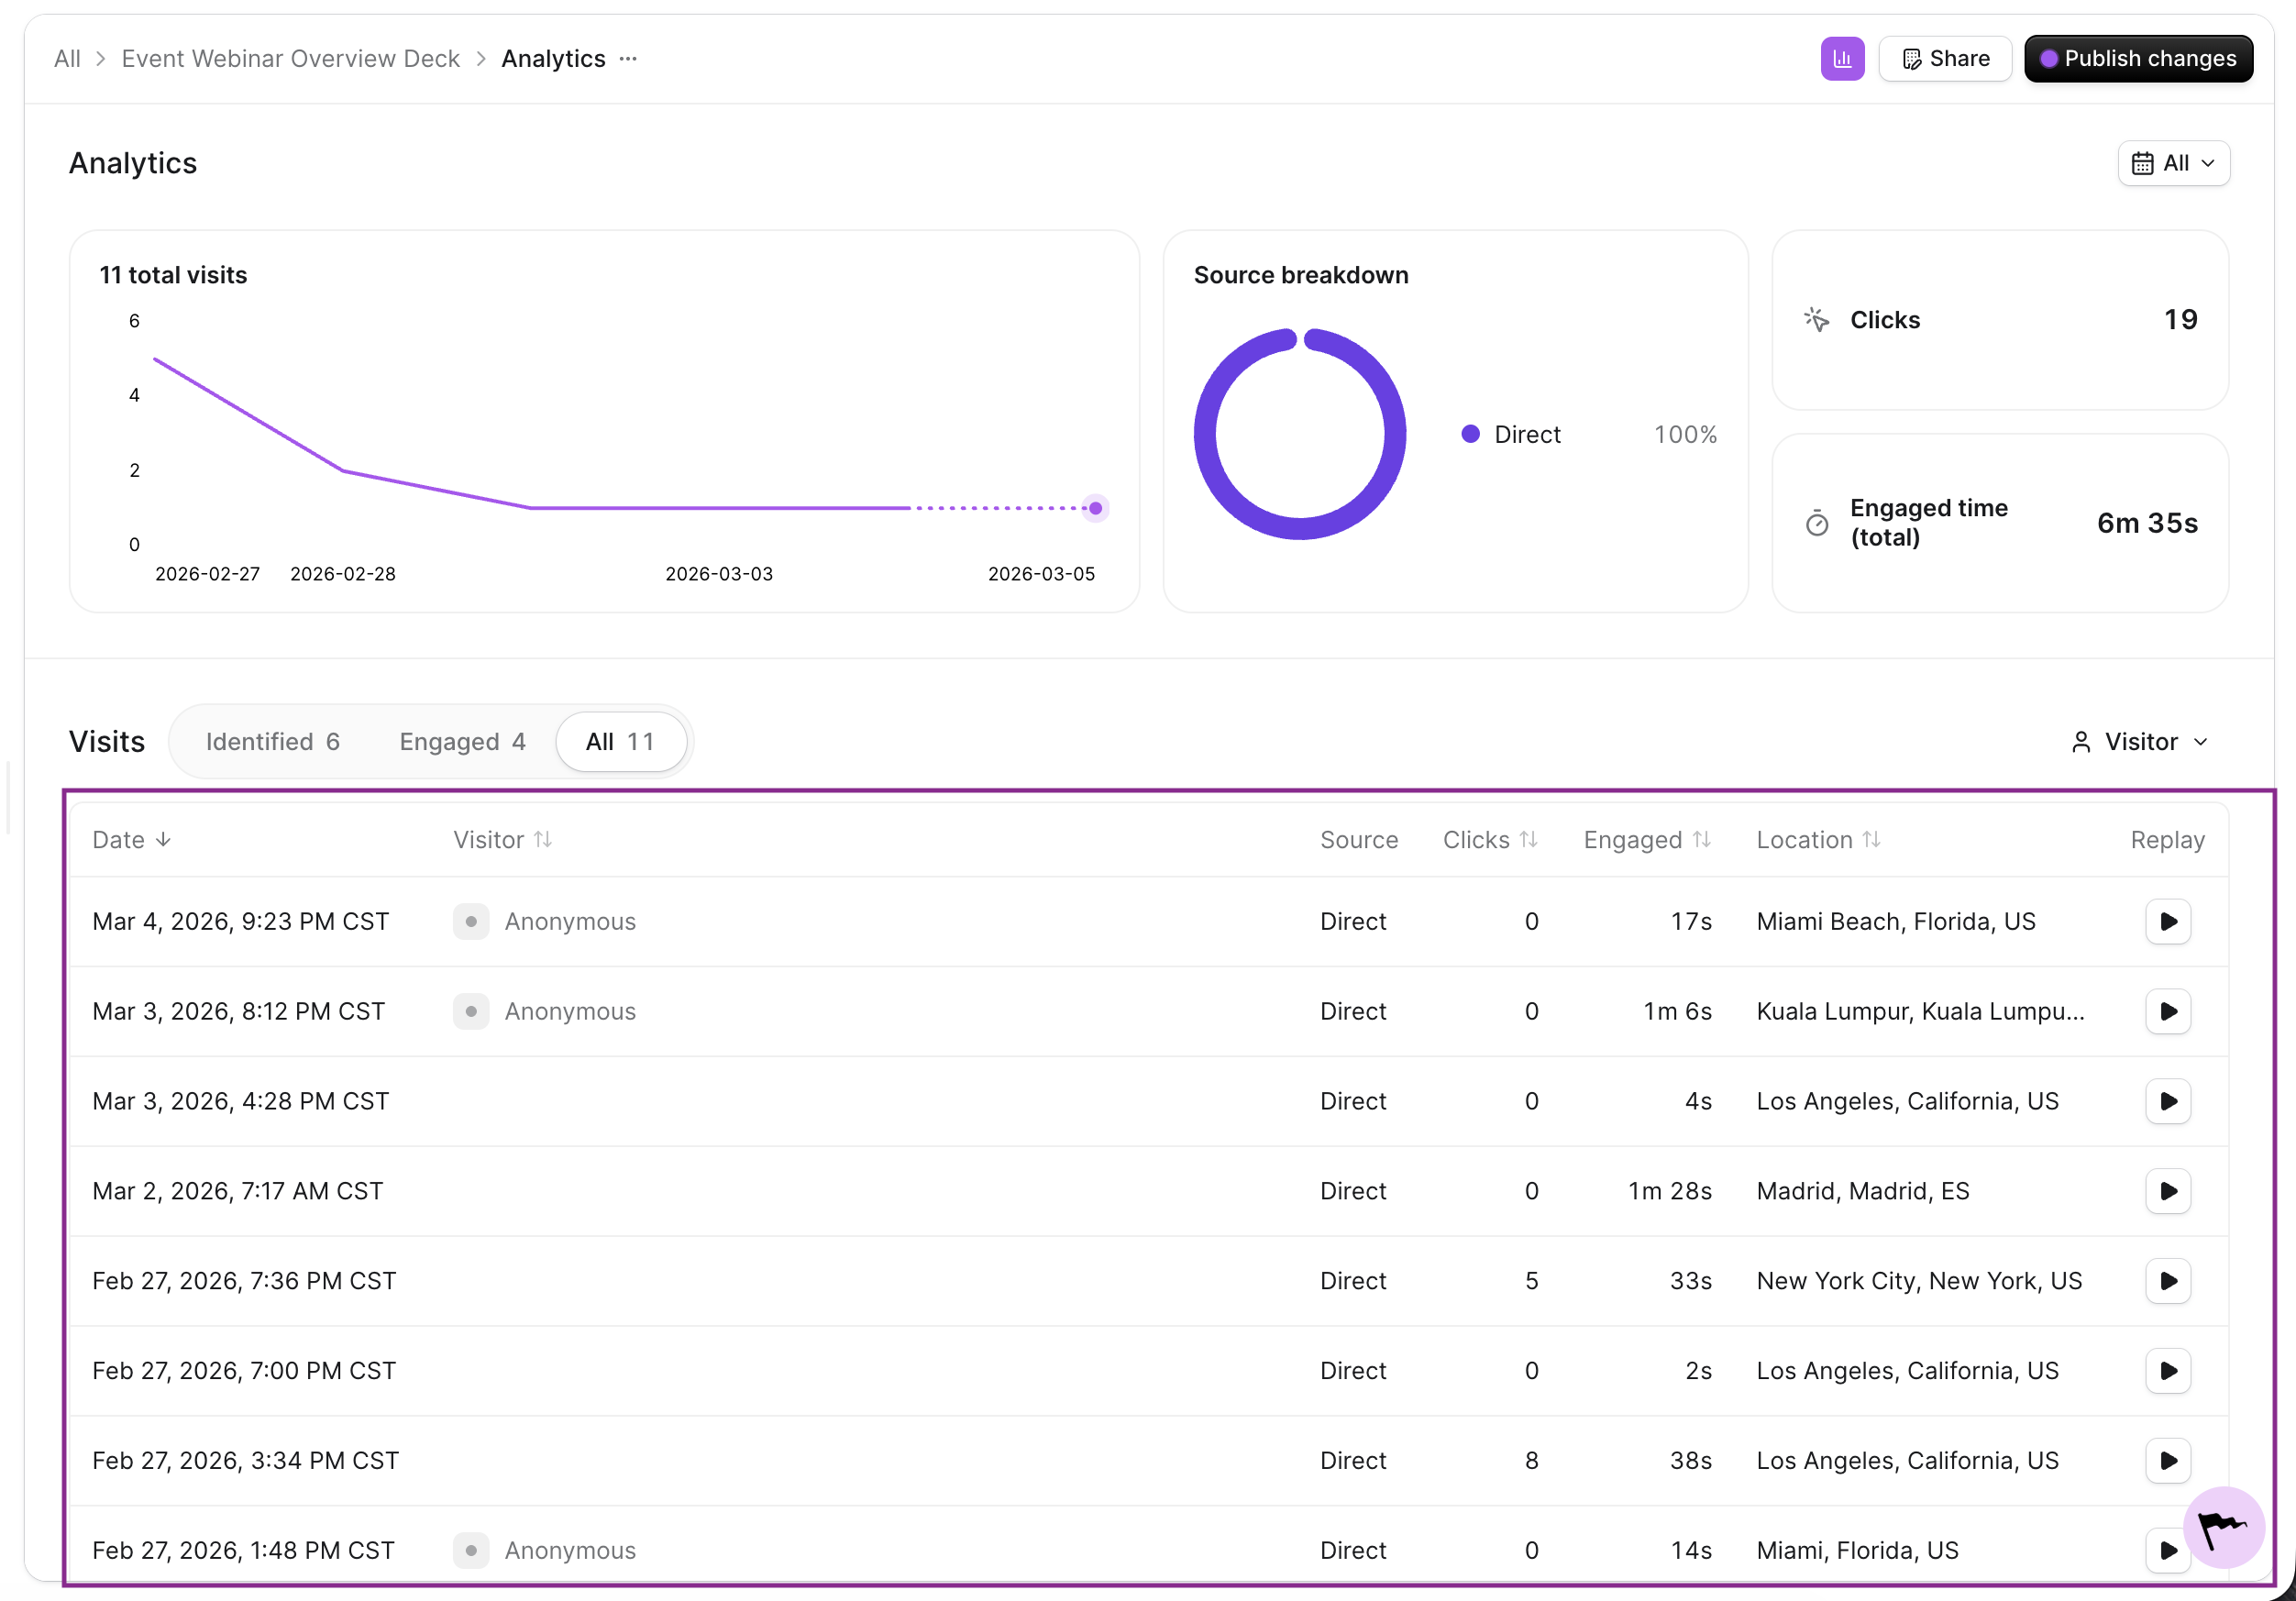
Below the top-level metrics, the visits table lets you break down your traffic. You can switch between three views: identified, engaged, or all.
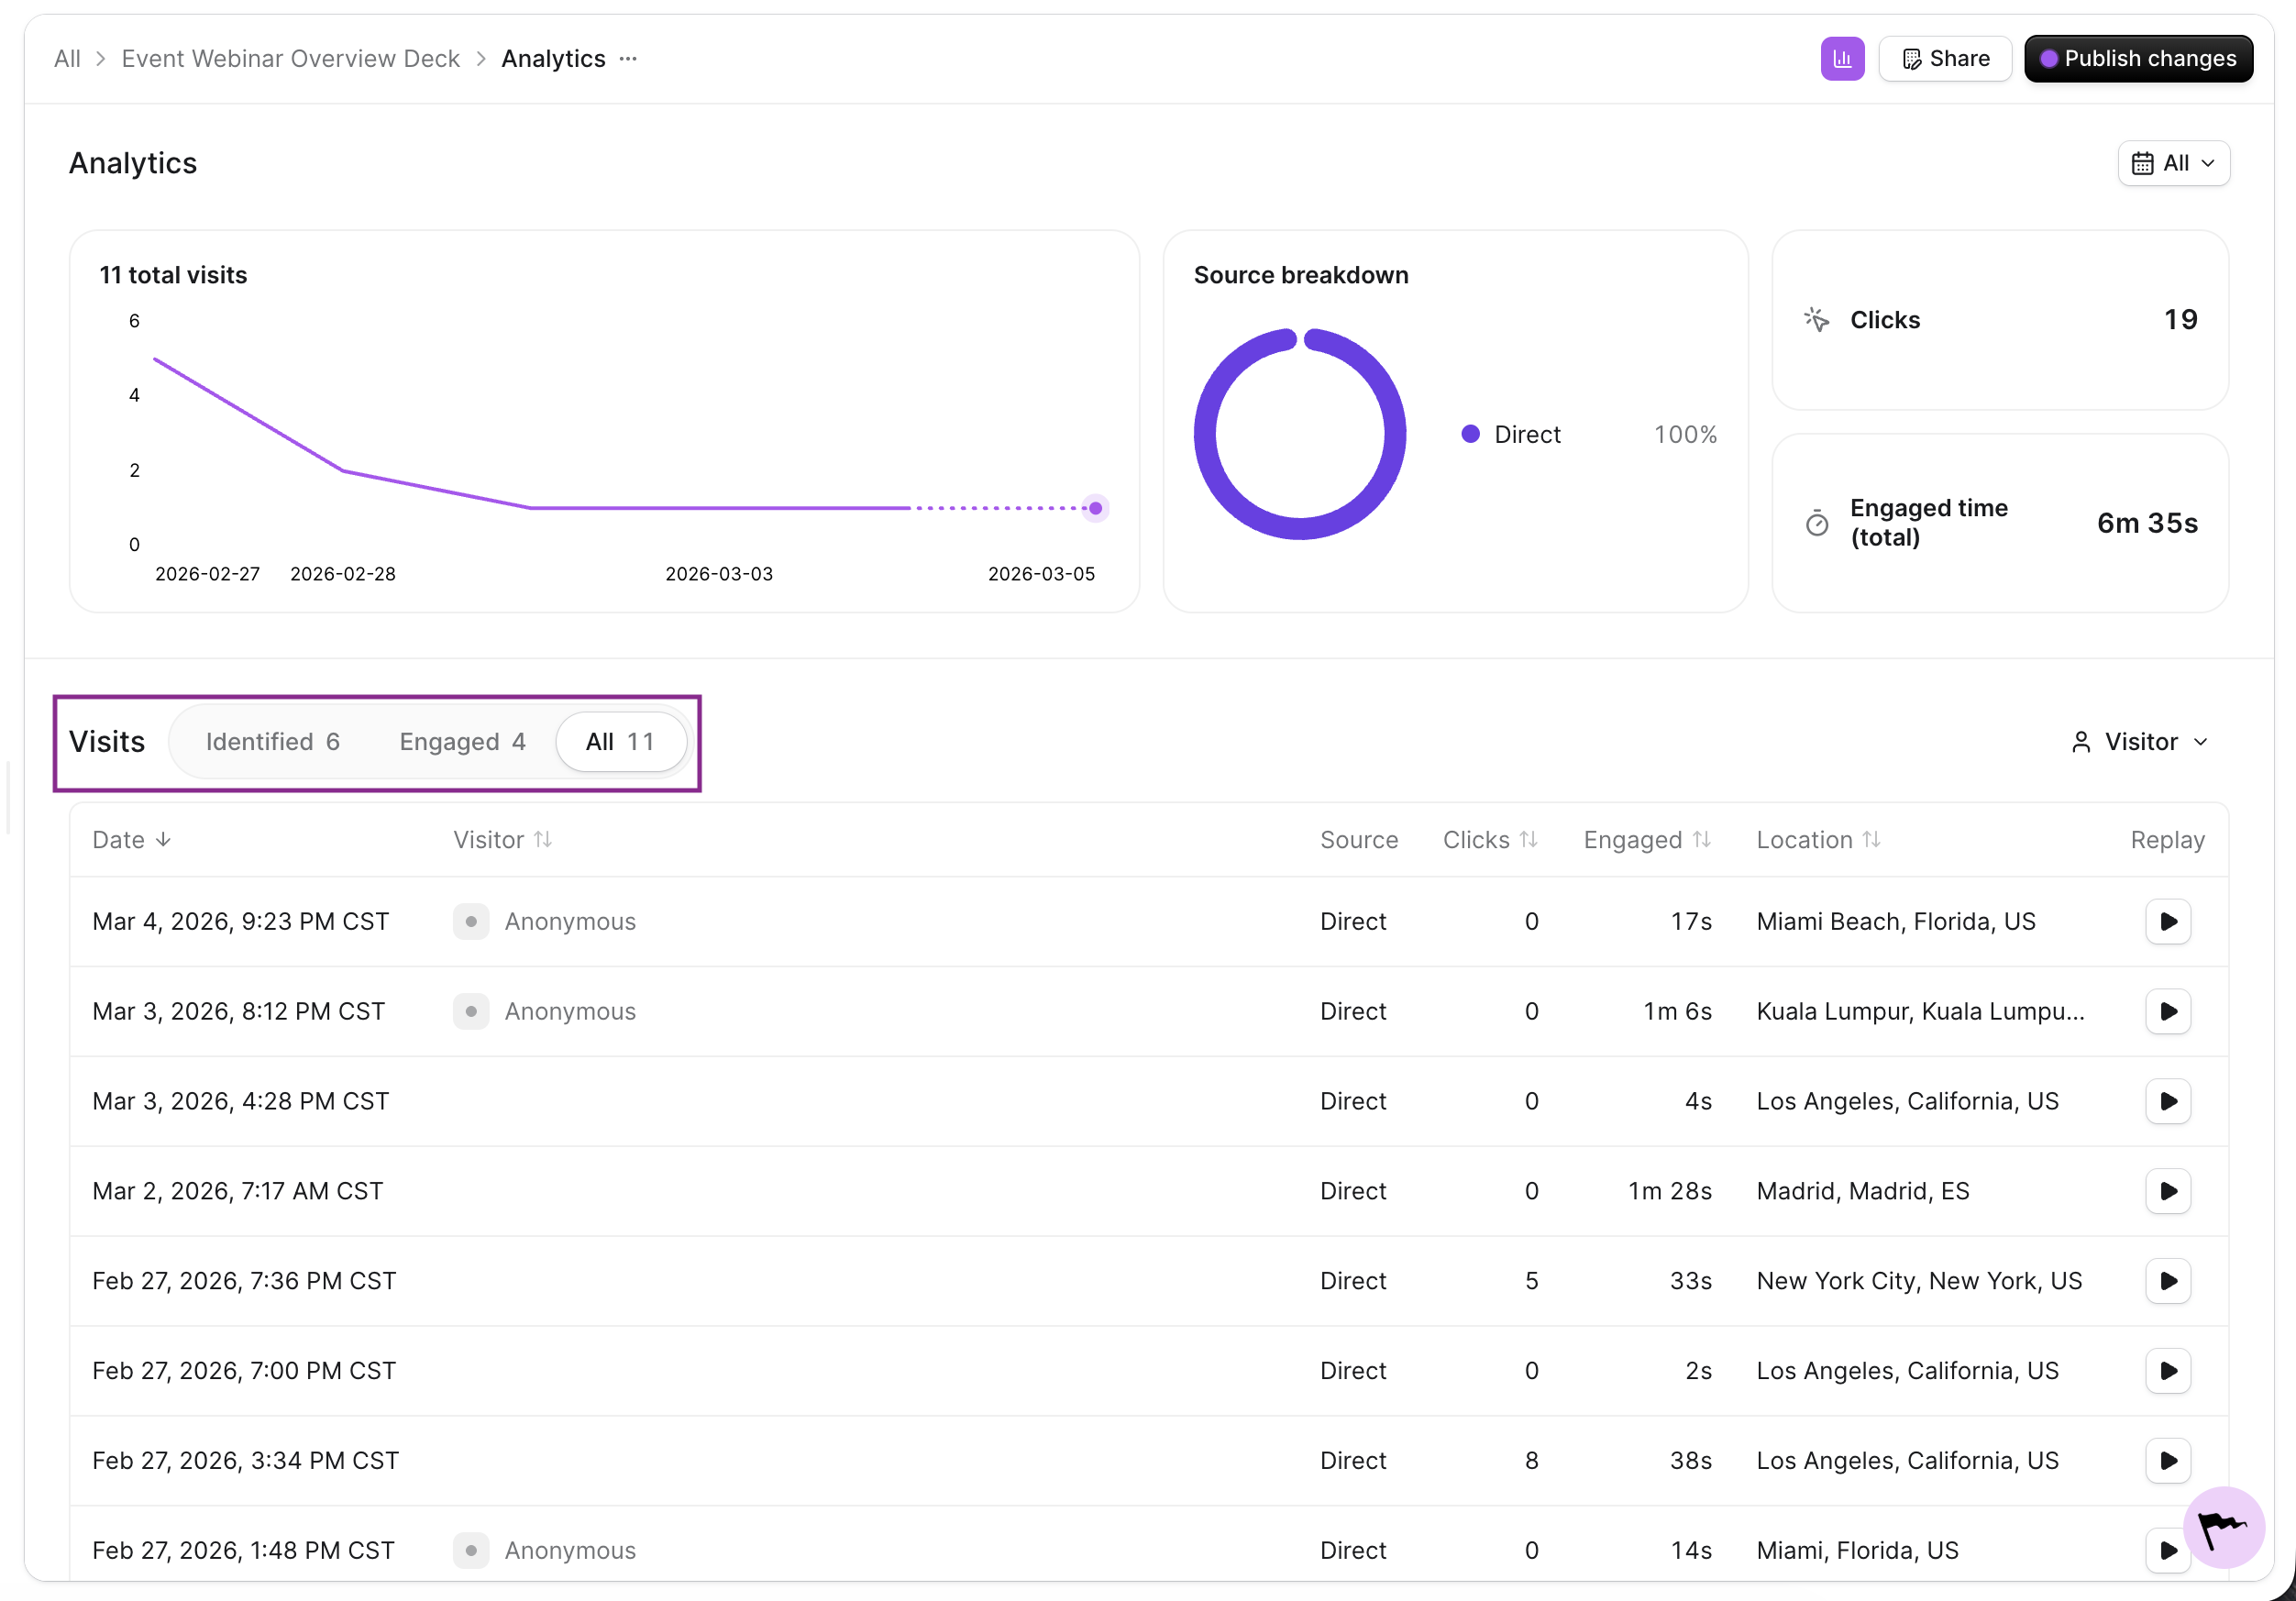
Identified shows visits from contacts who have been identified, so you can see exactly which known contacts have viewed your asset. Engaged shows visits with clicks, meaning visitors who actually interacted with the asset. All shows a roll up of every visit, whether identified or anonymous, engaged or not.
Visit details
Each row in the visits table includes:
The date of the visit
The visitor's source, if they were identified
Their number of clicks
How long they were engaged
Their location
A session replay, if your plan allows it, so you can watch exactly how the visitor engaged with your asset
Session Replays
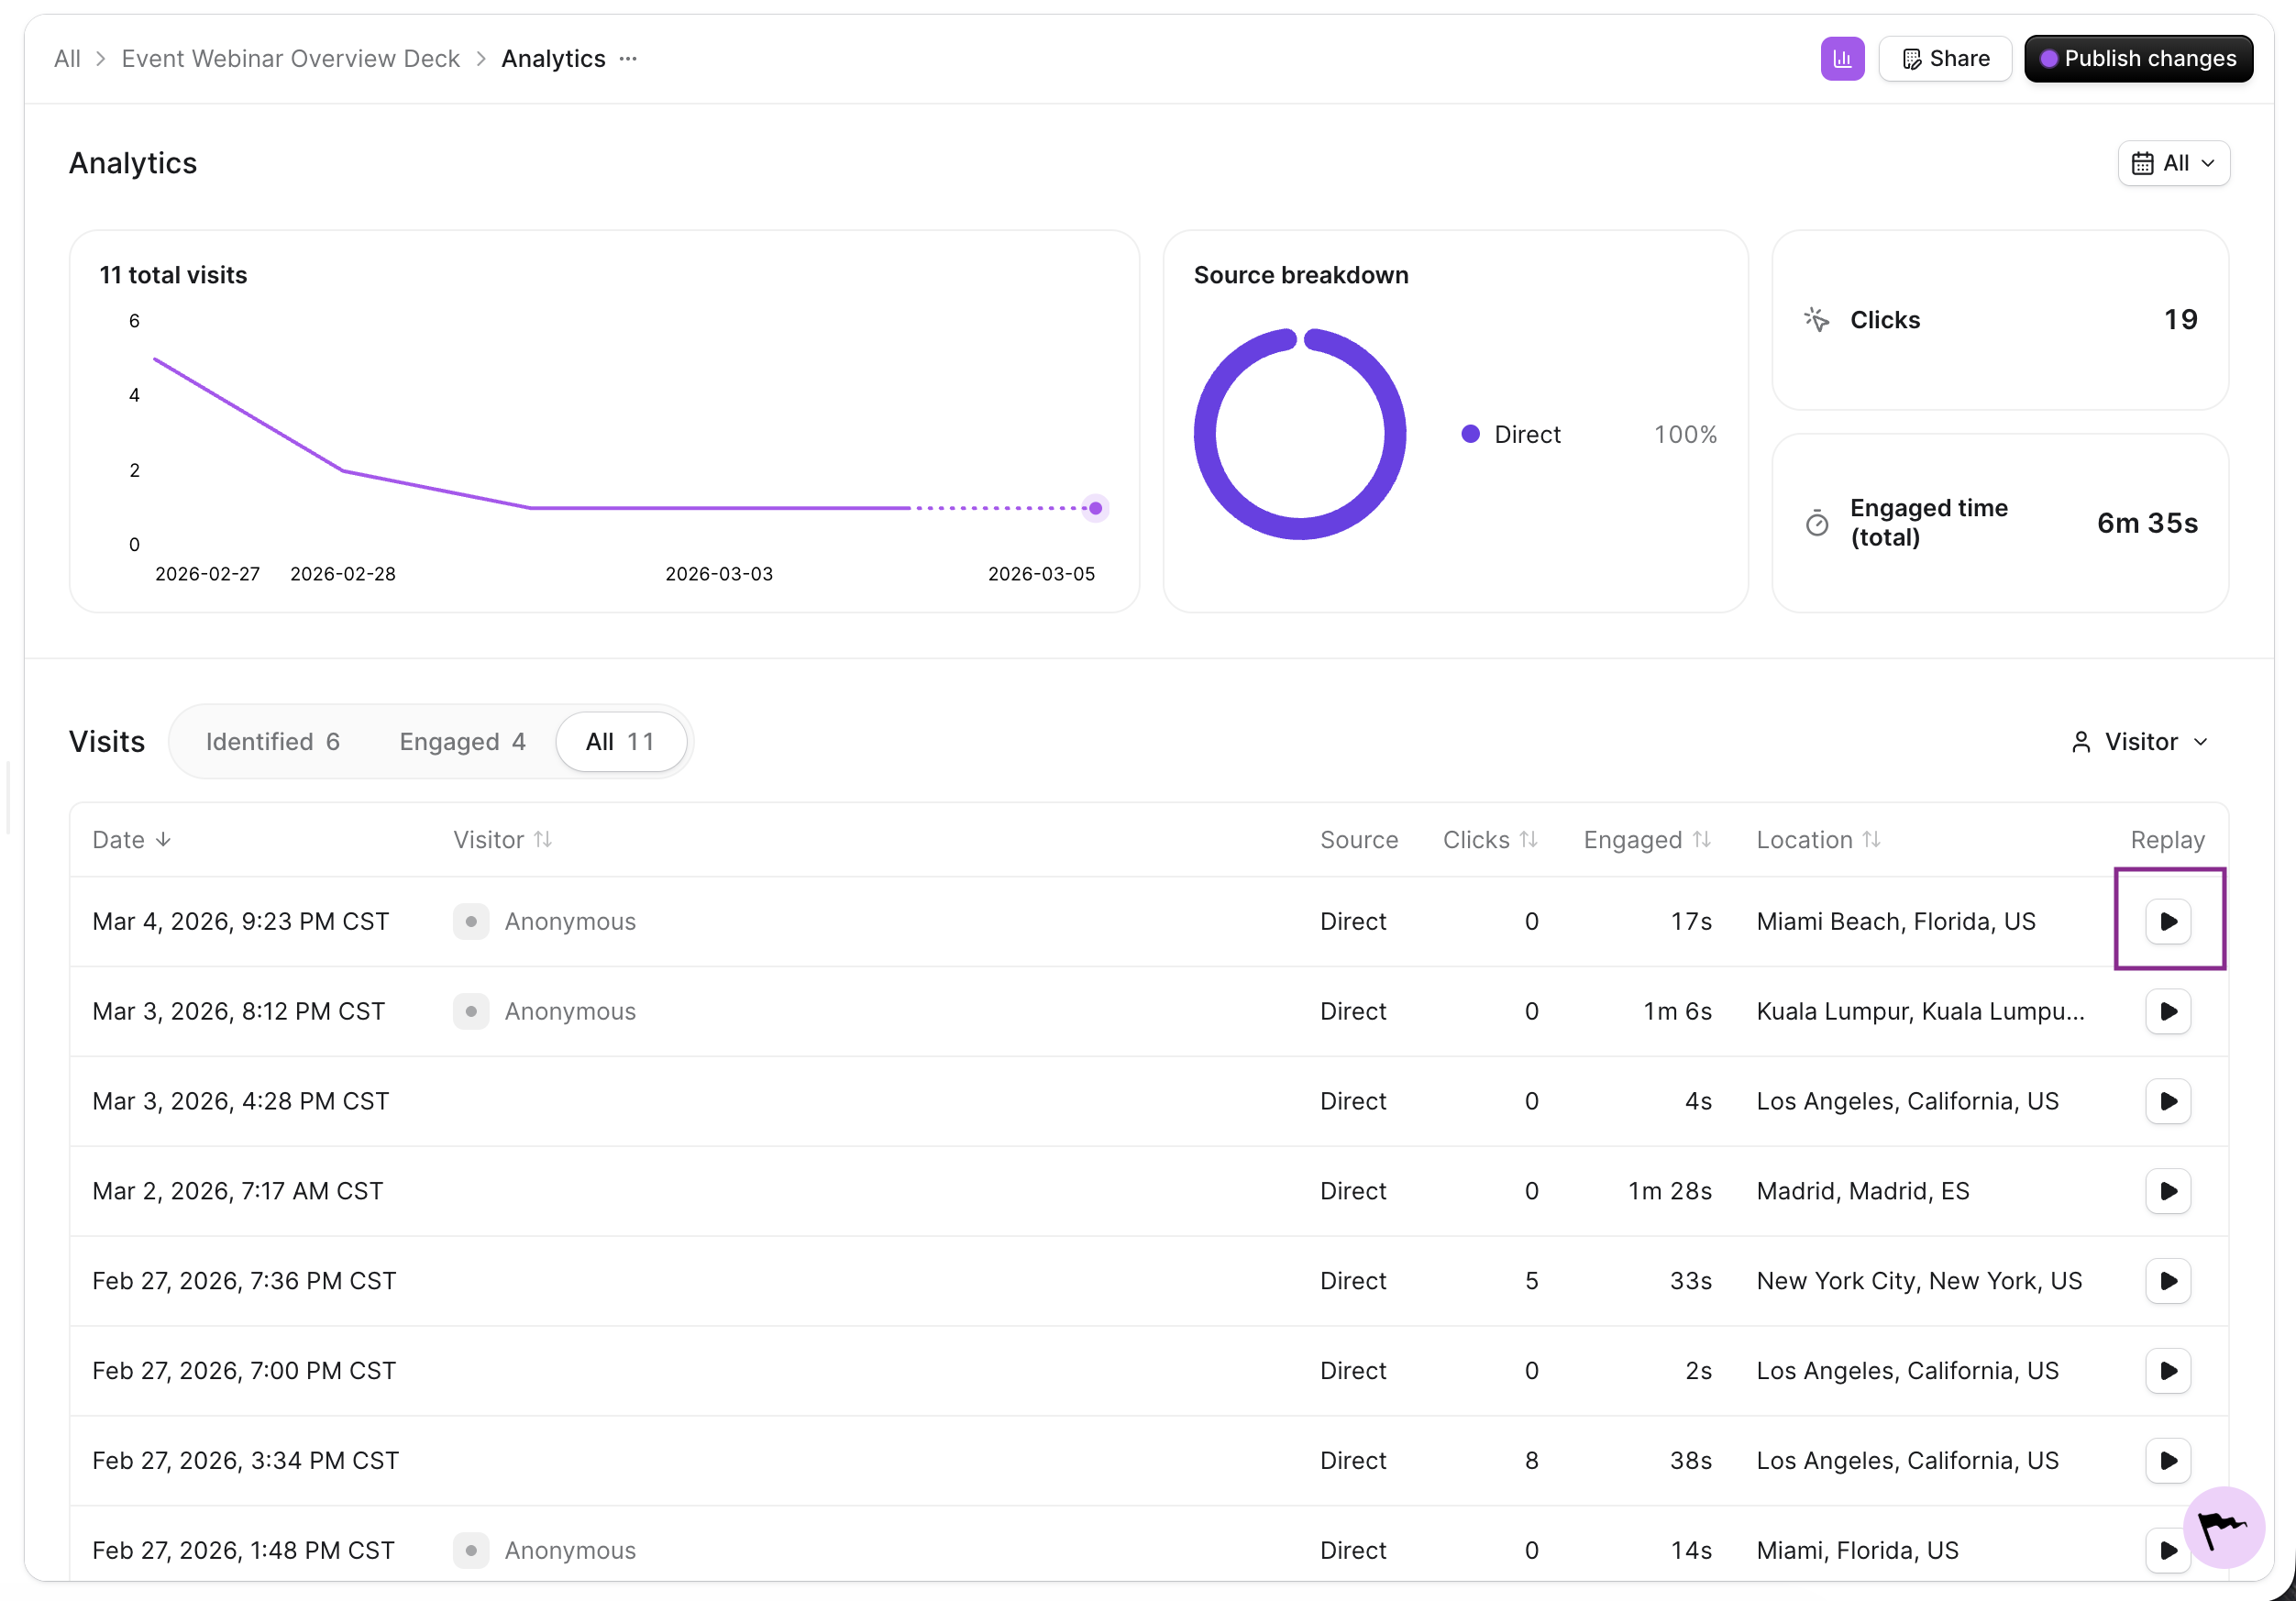
You can watch a session replay directly from the visits table to get a front-row seat to how a specific visitor interacted with your content.
Filtering Analytics
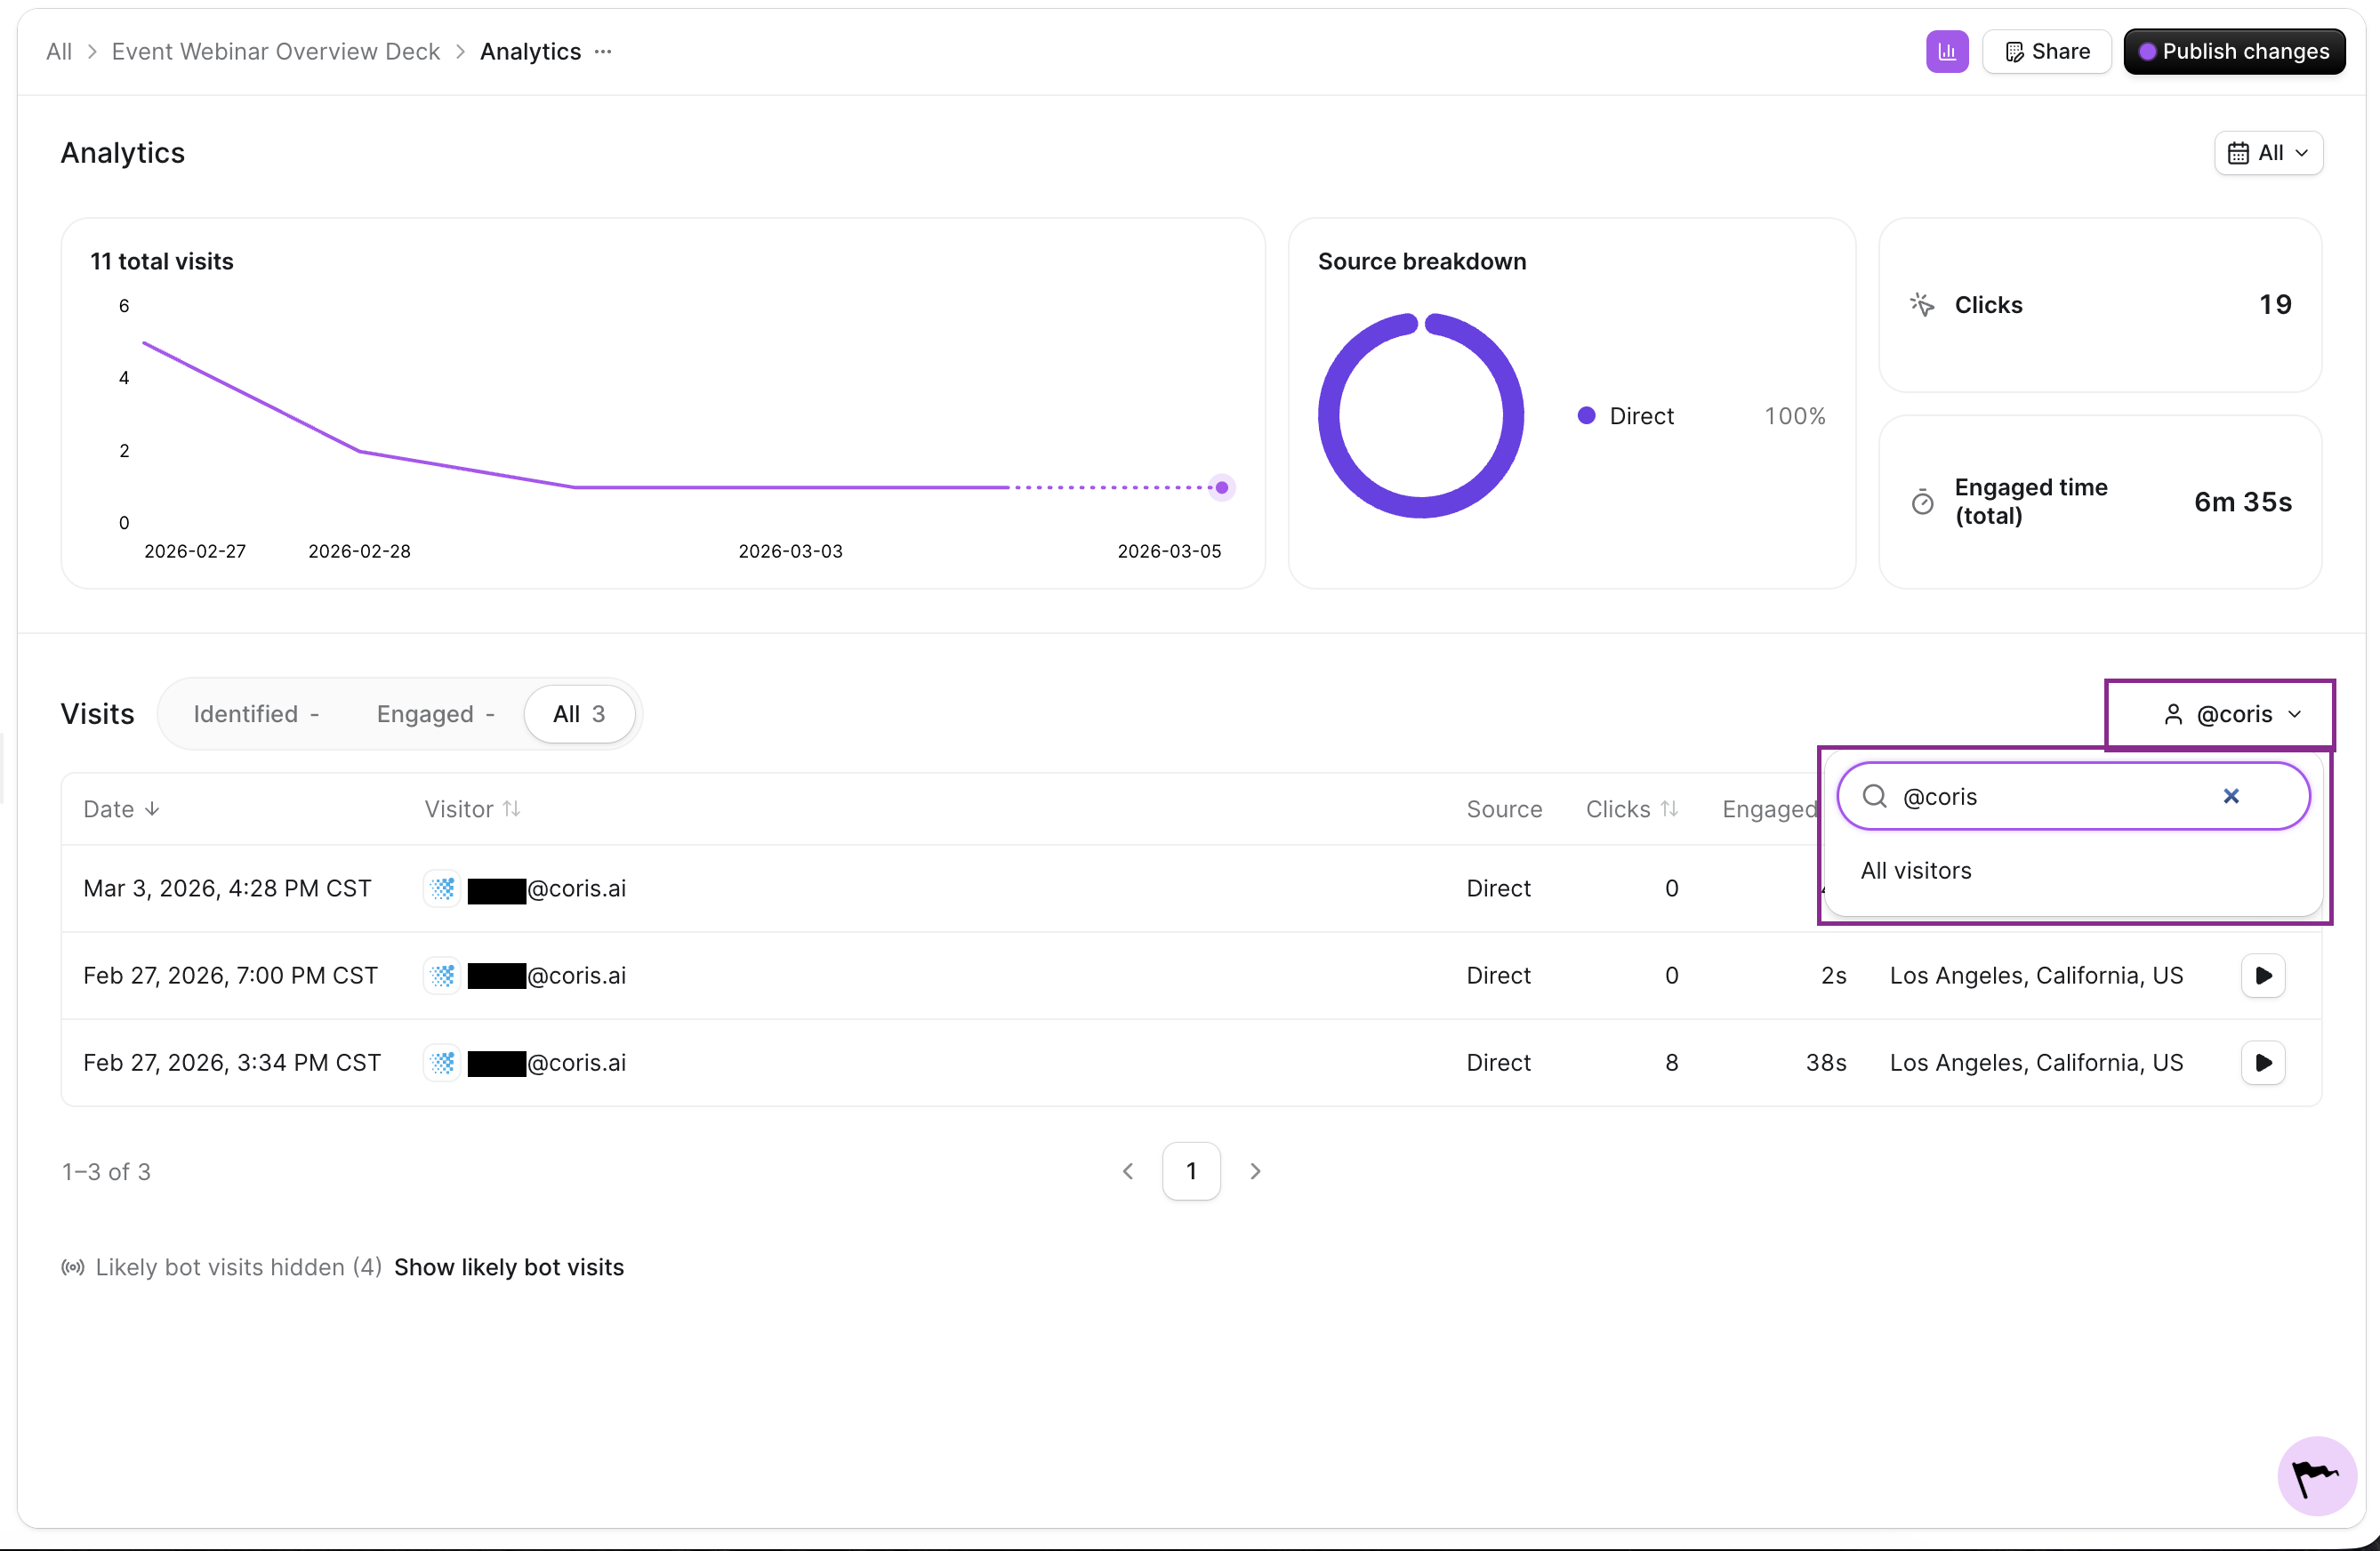
If you want to view visits from a specific account, you can click the Visitor Filter option in the top right of the visits table. From here, you can enter the domain of the account to only view the visits from that domain
Generating analytics reports with the agent
Alongside the analytics page, you can ask the agent in a thread to generate analytics reports for your assets. The agent has full access to all analytics across the assets you have access to, so whatever you want to learn, you can just prompt it.
For example, if you want to see your top engaged accounts across a set of assets, ask the agent, and it will generate the report for you. You can then add that report to an asset to share internally.
Here are some example prompts you can use to get started on analytics reports with the agent:
View top engaged accounts across all assets
Generate a report to show which accounts have engaged the most with my published assets.
View top engaged contacts across all assets
Generate a report to show which contacts have engaged the most with my published assets.
Track Your Traffic Sources
Understanding where your visitors come from helps you optimize your distribution strategy. Channel attribution is handled through UTM parameters, following HubSpot's definitions of default channel groupings.
You can read more about how this works here:
Custom Analytics Scripts
You can install your own analytics scripts, such as Google Analytics or Adobe Analytics, directly on your assets for additional reporting. We have a few articles on how to add scripts to your assets:
Need Help?
If you have questions or need help, the Mutiny Support team is here for you! You can submit a support ticket using the Submit a ticket button at the top of this page, or reach us at support@mutinyhq.com.